Owned by credit and procurement. They read balance sheets and decide whether to extend terms or renew a contract.
Goods arriving late
Owned by logistics. They watch orders and decide where to add buffer stock or chase a carrier.
Commercial risk scores exist, but they're paid for, refreshed every so often, and rarely say why a score is what it is.
What CEROP does
Two independent models, on purpose
Supplier risk
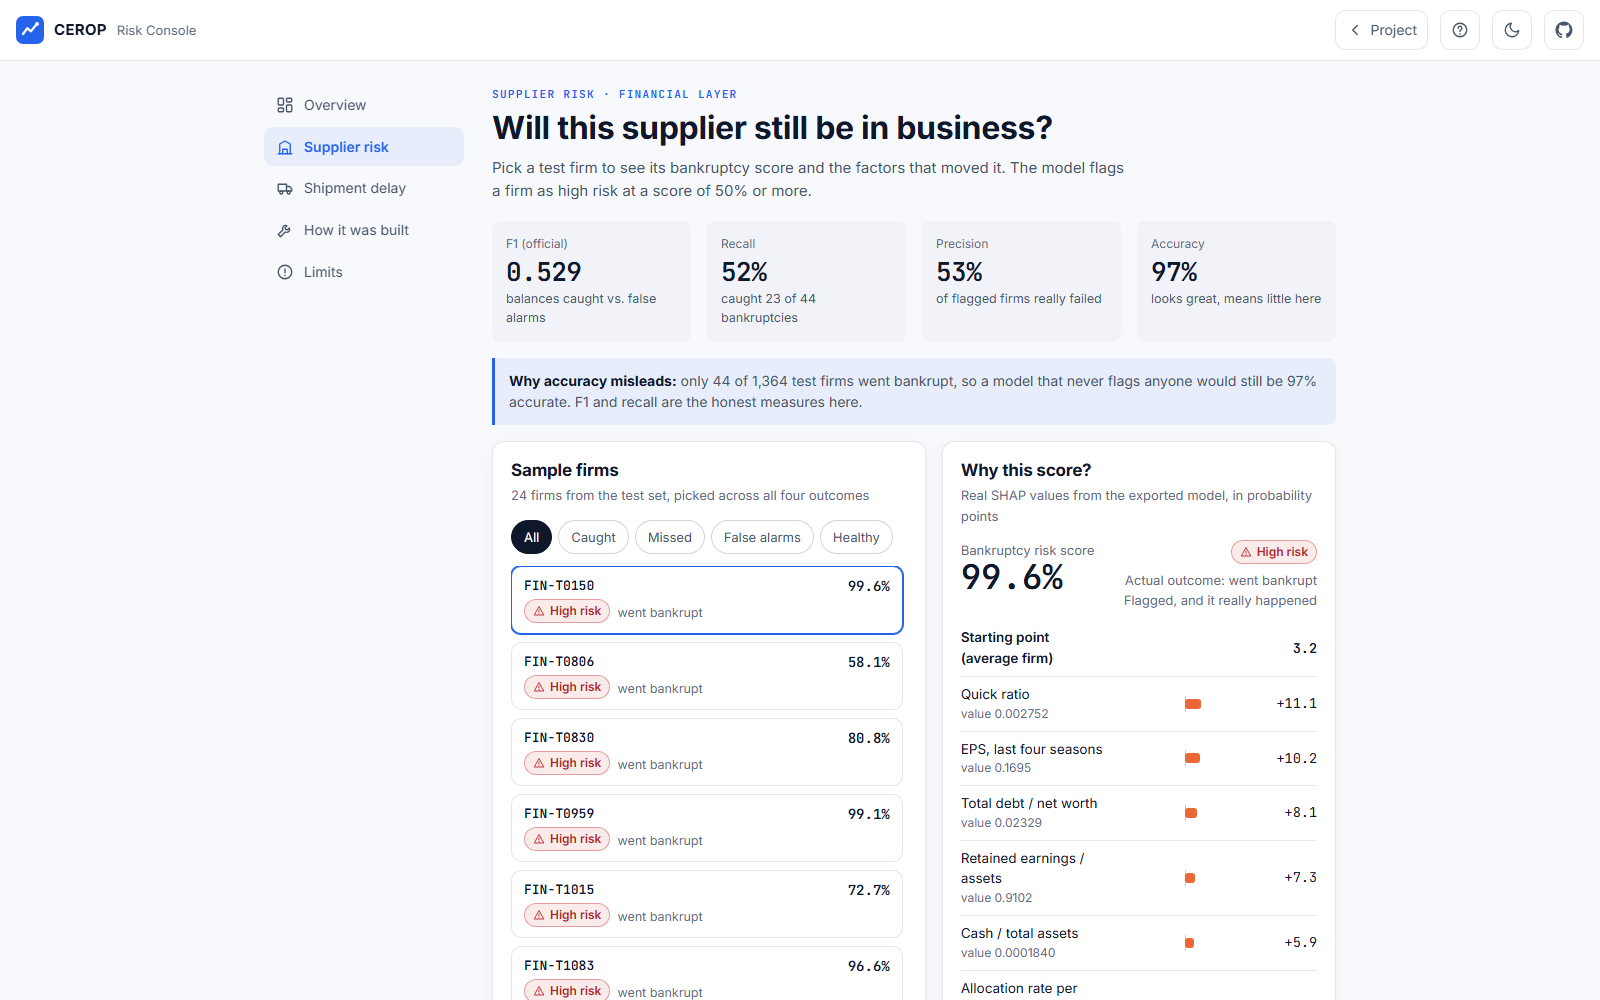
XGBoost on 85 financial ratios. Output: the chance a firm goes bankrupt, plus the factors behind it.
Shipment delay
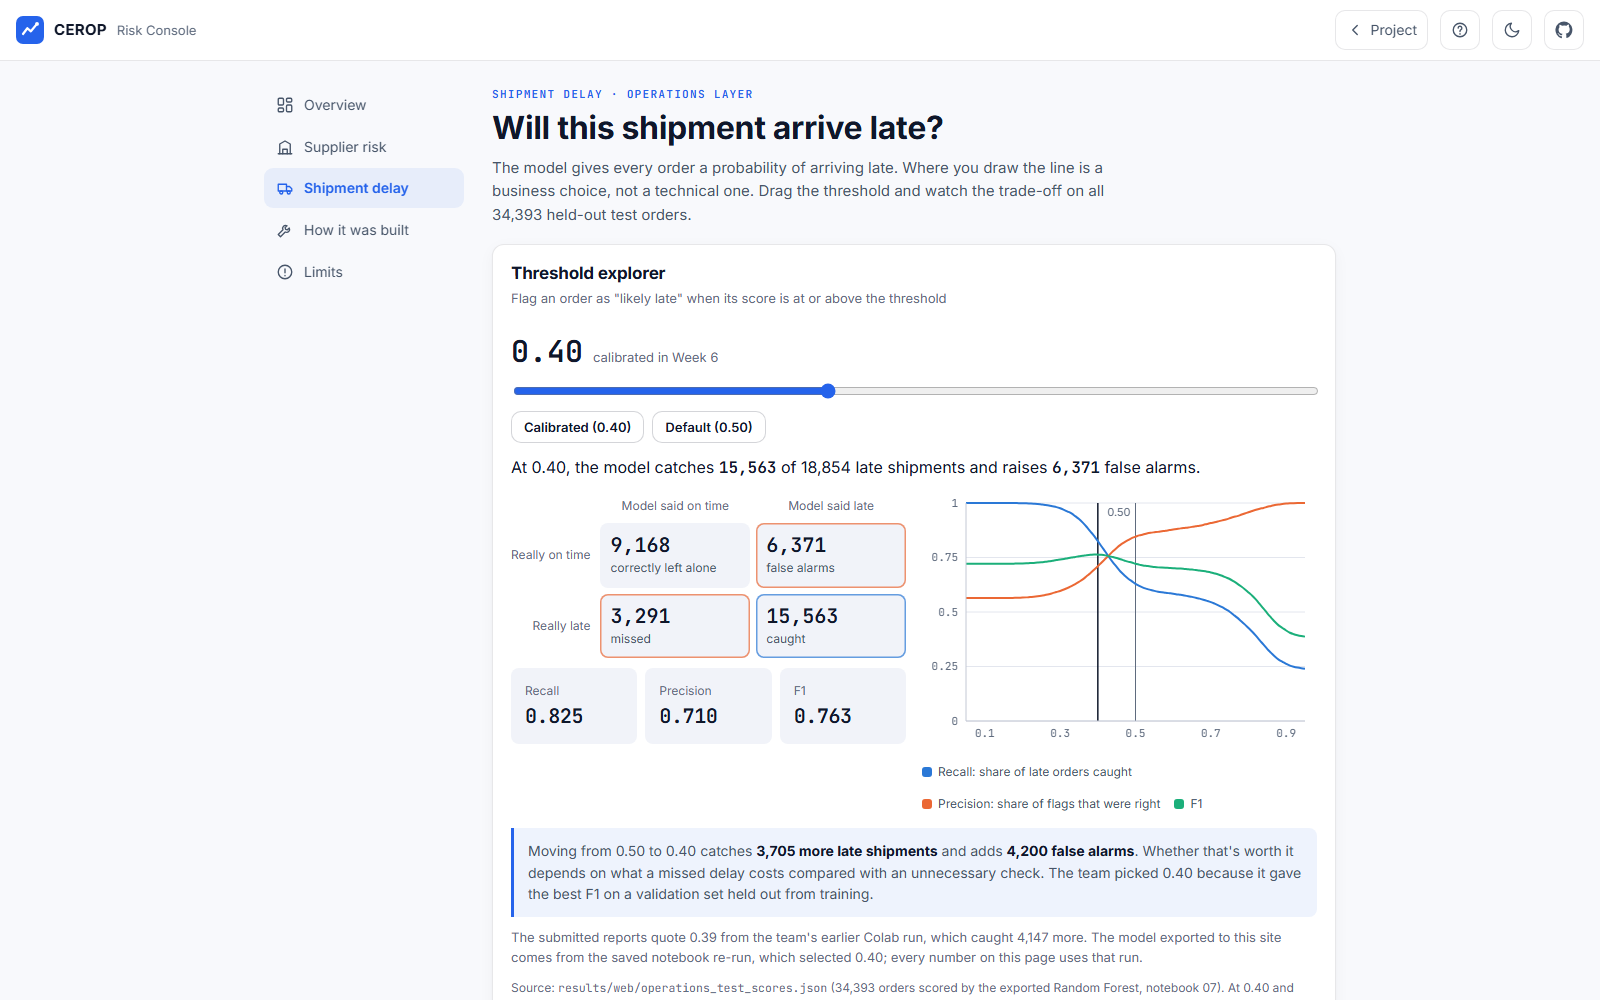
Random Forest on 27 order features. Output: the chance an order arrives late, plus the factors behind it.
They're deliberately not merged. A solvent supplier can still ship late, and a failing one can ship on time right up to the end. One blended number would hide what each team needs to see.
Data
Three public datasets, two very different balances
Taiwan bankruptcy (UCI)
6,819
firms, 1999–2009; 3.2% went bankrupt
DataCo supply chain (Mendeley)
171,962
orders after cleaning; 55% arrived late
NY Fed GSCPI
monthly
global supply-chain pressure, joined to each order's month
Counted from the label files: results/web/dataset_facts.json (notebook 07).
Pipeline
From raw data to a score you can question
Datathree public sources
Cleaningsentinel values, IDs and free text out
Leakage checksnothing known only after delivery
Model selectionthree candidates per layer
Tuning & thresholdsearch, then calibrate
Exportsaved once, loaded read-only
Scoring + SHAPevery explanation adds up
Consoletry it in a browser
One rule throughout: split first, then fit. Scalers, encoders and clipping bounds learn from training data only.
Catching leakage
A model that knows the answer looks great and fails
Actual shipping days and delivery status were the strongest predictors of lateness, and both are only known after delivery. Removed in Week 4.
Order Status: kept in Week 4, then judged a possible leak in Week 6 and dropped, taking the model from 35 to 27 inputs.
An unreliable tail: orders from October 2017 on behaved erratically, so 8,557 rows were removed before the split.
Checks that must pass before any model runs: no missing values, every value finite, train and test with the same columns.
Notebook 03 (asserts in cells 10 and 32); row counts from Final Report Table 5.
Choosing the financial model
Why 97% accuracy is the wrong metric
Test set, threshold 0.50. Final Report Table 7.
A model that calls every firm safe would be 96.8% accurate on our test set and catch nothing.
So we compared recall, precision and F1. Logistic Regression catches the most failures (recall 0.818) but most of its alarms are wrong (precision 0.186).
XGBoost has the best balance: F1 0.529, ROC-AUC 0.950.
Financial result
XGBoost on 1,364 unseen firms
Said solvent
Said bankrupt
Really solvent
1,300cleared
20false alarms
Really bankrupt
21missed
23caught
F1
0.529
ROC-AUC
0.950
For a credit analyst: it caught 23 of 44 bankruptcies, and 23 of its 43 flags were real. A strong pointer to which files to read first, not a decision on its own.
Official result: results/week6_financial_tuning_results.csv, row "XGBoost - Week 5 published".
Week 6
Tuning didn't help, and that's a finding
Layer
Configuration
F1 at 0.50
Financial
Week 5 settings (tuning split)
0.568
Financial
Tuned XGBoost (same split)
0.505
Operations
Baseline Random Forest
0.724
Operations
Tuned Random Forest
0.721
A bootstrap over 2,000 resamples put the financial change in PR-AUC between -0.135 and 0.025: indistinguishable from noise. We kept the Week 5 model.
Moving the shipment model's line from 0.50 to 0.40:
Late orders caught
+3,705
False alarms
+4,200
Recall 0.825, F1 0.763 on 34,393 test orders. Whether that trade is worth it depends on what a missed delay costs.
Explaining each case
Real SHAP, checked to add up
For every case shown, the starting point plus all feature contributions equals the score within 1e-6. Scheduled days and shipping mode carry the same information in this data, so read them together.
results/web/financial_shap_cases.json, operations_shap_cases.json (notebook 07). Numbers are percentage points.
 CEROP