 CEROP
Which suppliers may go under. Which shipments will be late.
CEROP is two machine-learning models built side by side. One estimates whether a supplier will go bankrupt, the other whether an order will arrive late, and every score comes with a reason you can read.
Two risks that live with two different teams
A company buying across borders carries two separate worries. Will the supplier still be in business next quarter? Will this particular shipment arrive when it should? The first sits with credit or procurement. The second sits with logistics.
CEROP keeps those questions apart on purpose: two models, two scores. A solvent supplier can still ship late, and a failing one can ship on time right up to the end, so one blended number would hide what each team needs to see.
Supplier risk
Financial layer · XGBoost · 85 financial ratios
Trained and tested on 6,819 Taiwanese firms. Only 3.2% of them went bankrupt, which makes this a search for a rare event.
Shipment delay
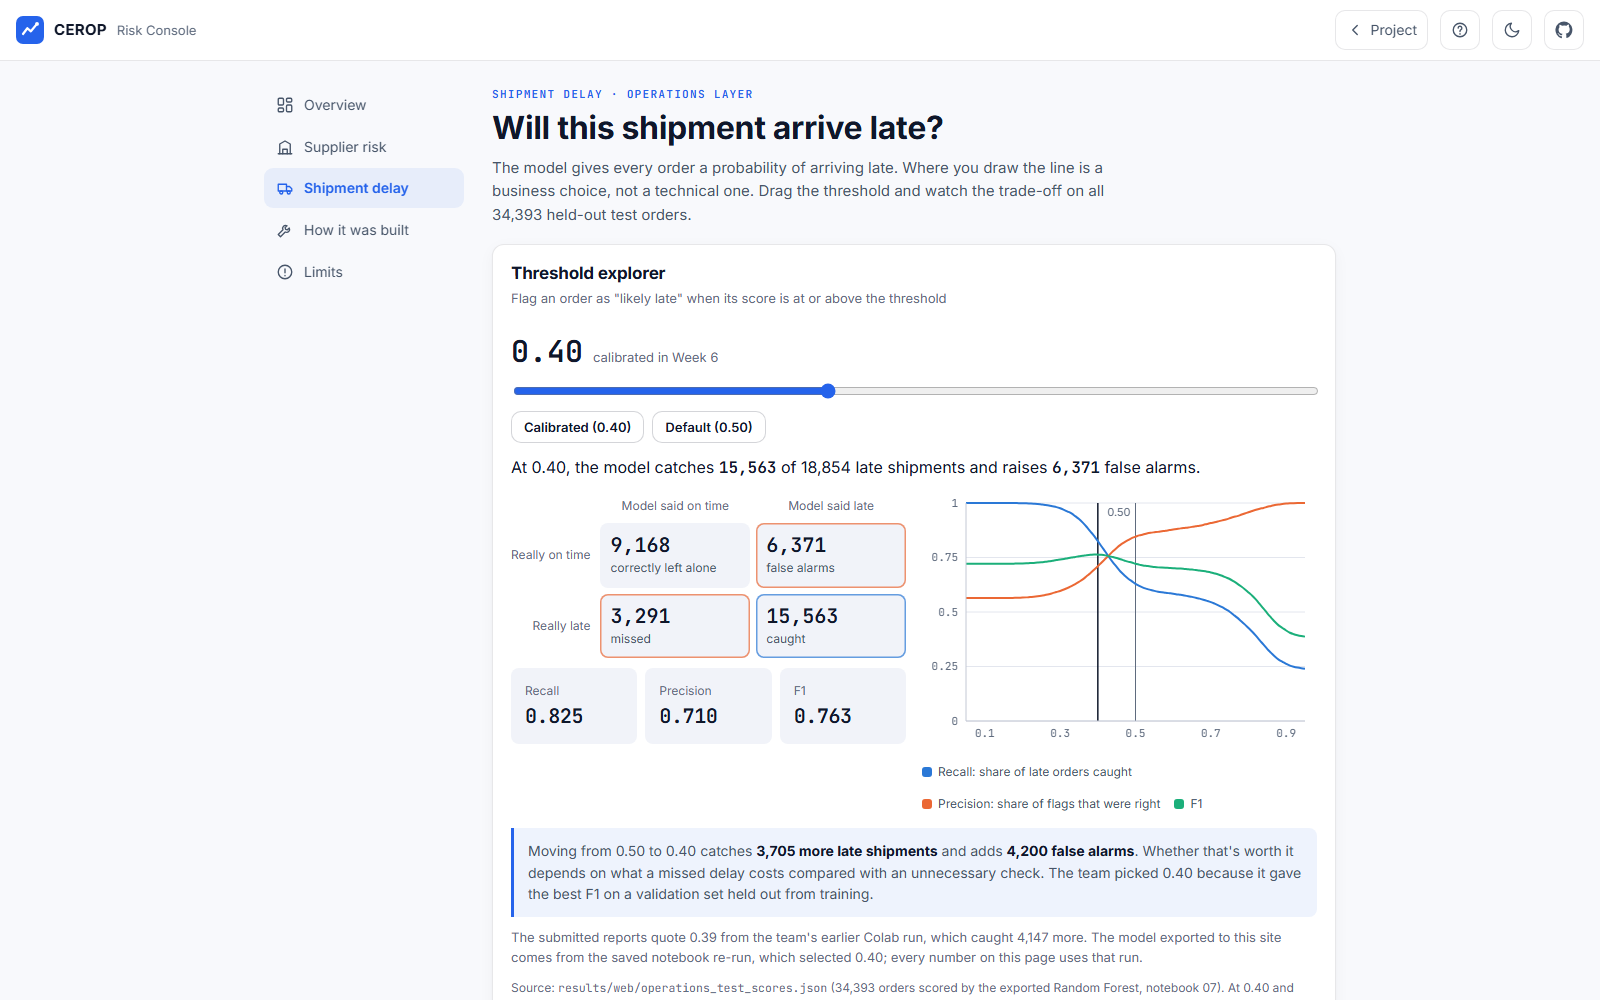
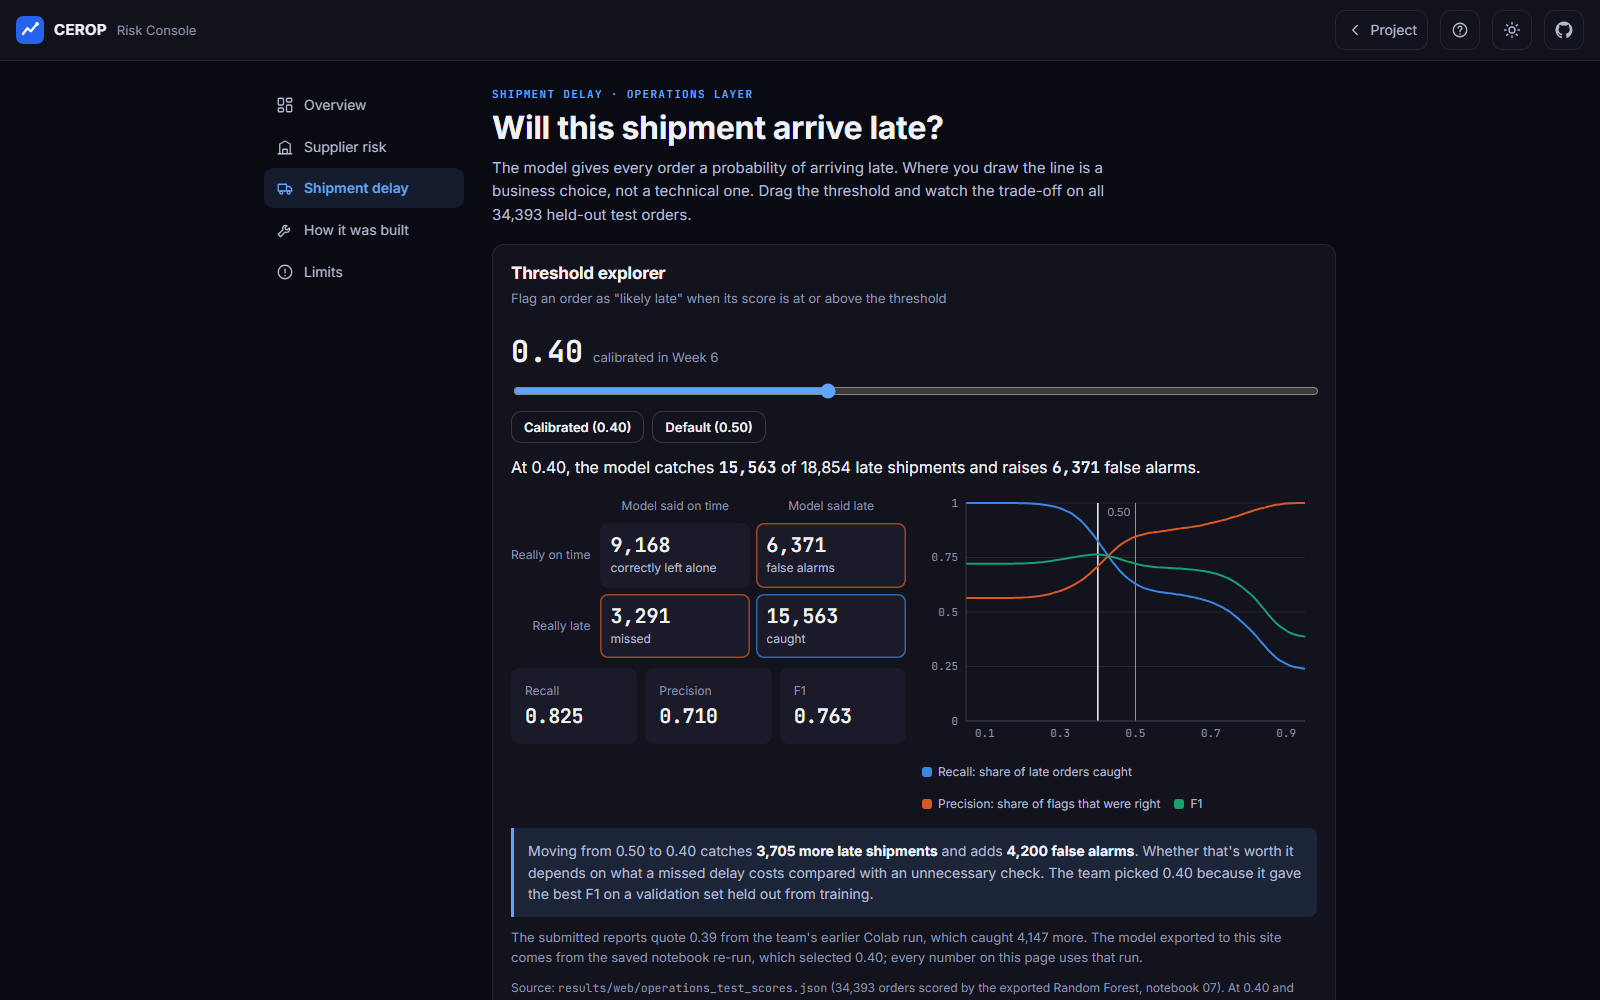
Operations layer · Random Forest · 27 order features
Trained and tested on 171,962 orders from the DataCo supply-chain dataset, where 55% arrived late.
What the models achieved on data they never saw
Financial figures are the official test-set results from the submitted report; operations figures come from the saved Week 6 notebook and the exported model. How these numbers were checked.
From raw data to a score you can question
Each layer goes through the same steps. The leakage checks and the threshold choice turned out to matter more than the choice of algorithm.
- DataTaiwan bankruptcy, DataCo orders, NY Fed GSCPI
- Cleaningsentinel values, IDs and free text out
- Leakage checksnothing known only after delivery
- Model selection3 candidates per layer
- Tuning & thresholdsearch, then calibrate
- Exportsaved once, loaded read-only
- Scoring + SHAPevery explanation adds up
- Consoletry it in the browser
Eight weeks, seven stages
The project ran week by week through the course. Each stage has its own page with what we asked, what we did, what we found and what changed because of it, plus the notebook and the report behind it.
Start the walkthrough- Week 2Framing the problemWhy two layers, and why accuracy was the wrong yardstick.→
- Week 3Data & explorationThree public datasets and two very different class balances.→
- Week 4Cleaning & pipelineRemoving leakage and an unreliable date tail.→
- Week 5Model selectionXGBoost for suppliers, Random Forest for shipments.→
- Week 6Tuning & thresholdsTuning didn't help. The threshold did.→
- Weeks 7–8Explainability & the demoReal SHAP, checked case by case, and a console to try it.→
- FinalResults, limits & lessonsWhat held up, what didn't, what I'd do next.→
Arthunya Kanoklertwongse (Aty)
CEROP was a four-person team project. My parts:
- Financial layer: exploring and cleaning the Taiwan bankruptcy data, including the sentinel-value tiers and capping rules.
- Leakage verification: finding and checking the Order Status leakage in the operations data, and auditing the team's notebooks and numbers.
- Live demo build: exporting the models, the scoring script, the SHAP explanations with their reconciliation checks, and the Risk Console.
- Coordination and writing: keeping the team's weekly deliverables on track and writing up the reports.
After the course I rebuilt the console and wrote this site and the deck, re-checking every number against the result files along the way.
The team
- Arthunya Kanoklertwongse financial layer, leakage checks, demo
- Ankit Kumar financial model selection and tuning
- Divya Gopal pipeline integration, operations selection and tuning
- Aswin Shriram Thiagarajan operations EDA and cleaning
Who wrote which notebook is listed on the Resources page.
A prototype, with known limits
Only 44 bankrupt firms are in the test set, the financial data is Taiwanese and ends in 2009, the shipment data is a teaching dataset, and tuning didn't beat the default settings. None of that is hidden. It's all written down.
Limits and what I'd do nextReproducibility, stated plainly
The exported financial model scores F1 0.533 on my machine against the reported 0.529, with the same code, data and seed. The difference comes from library versions. The reported figure stays the official one, and the gap is explained wherever it shows up.